TransMAP Analytics Hub
While the TransMAP Hub Explorer interface facilitates exploratory access to the TransMAP Hub Data Repository, the overall functionality for more intermediate and advanced consumers is somewhat limiting. Therefore, two approaches are currently under active development to accommodate researchers looking to gain deeper insights into the data repository without exporting and/or downloading entire datasets.
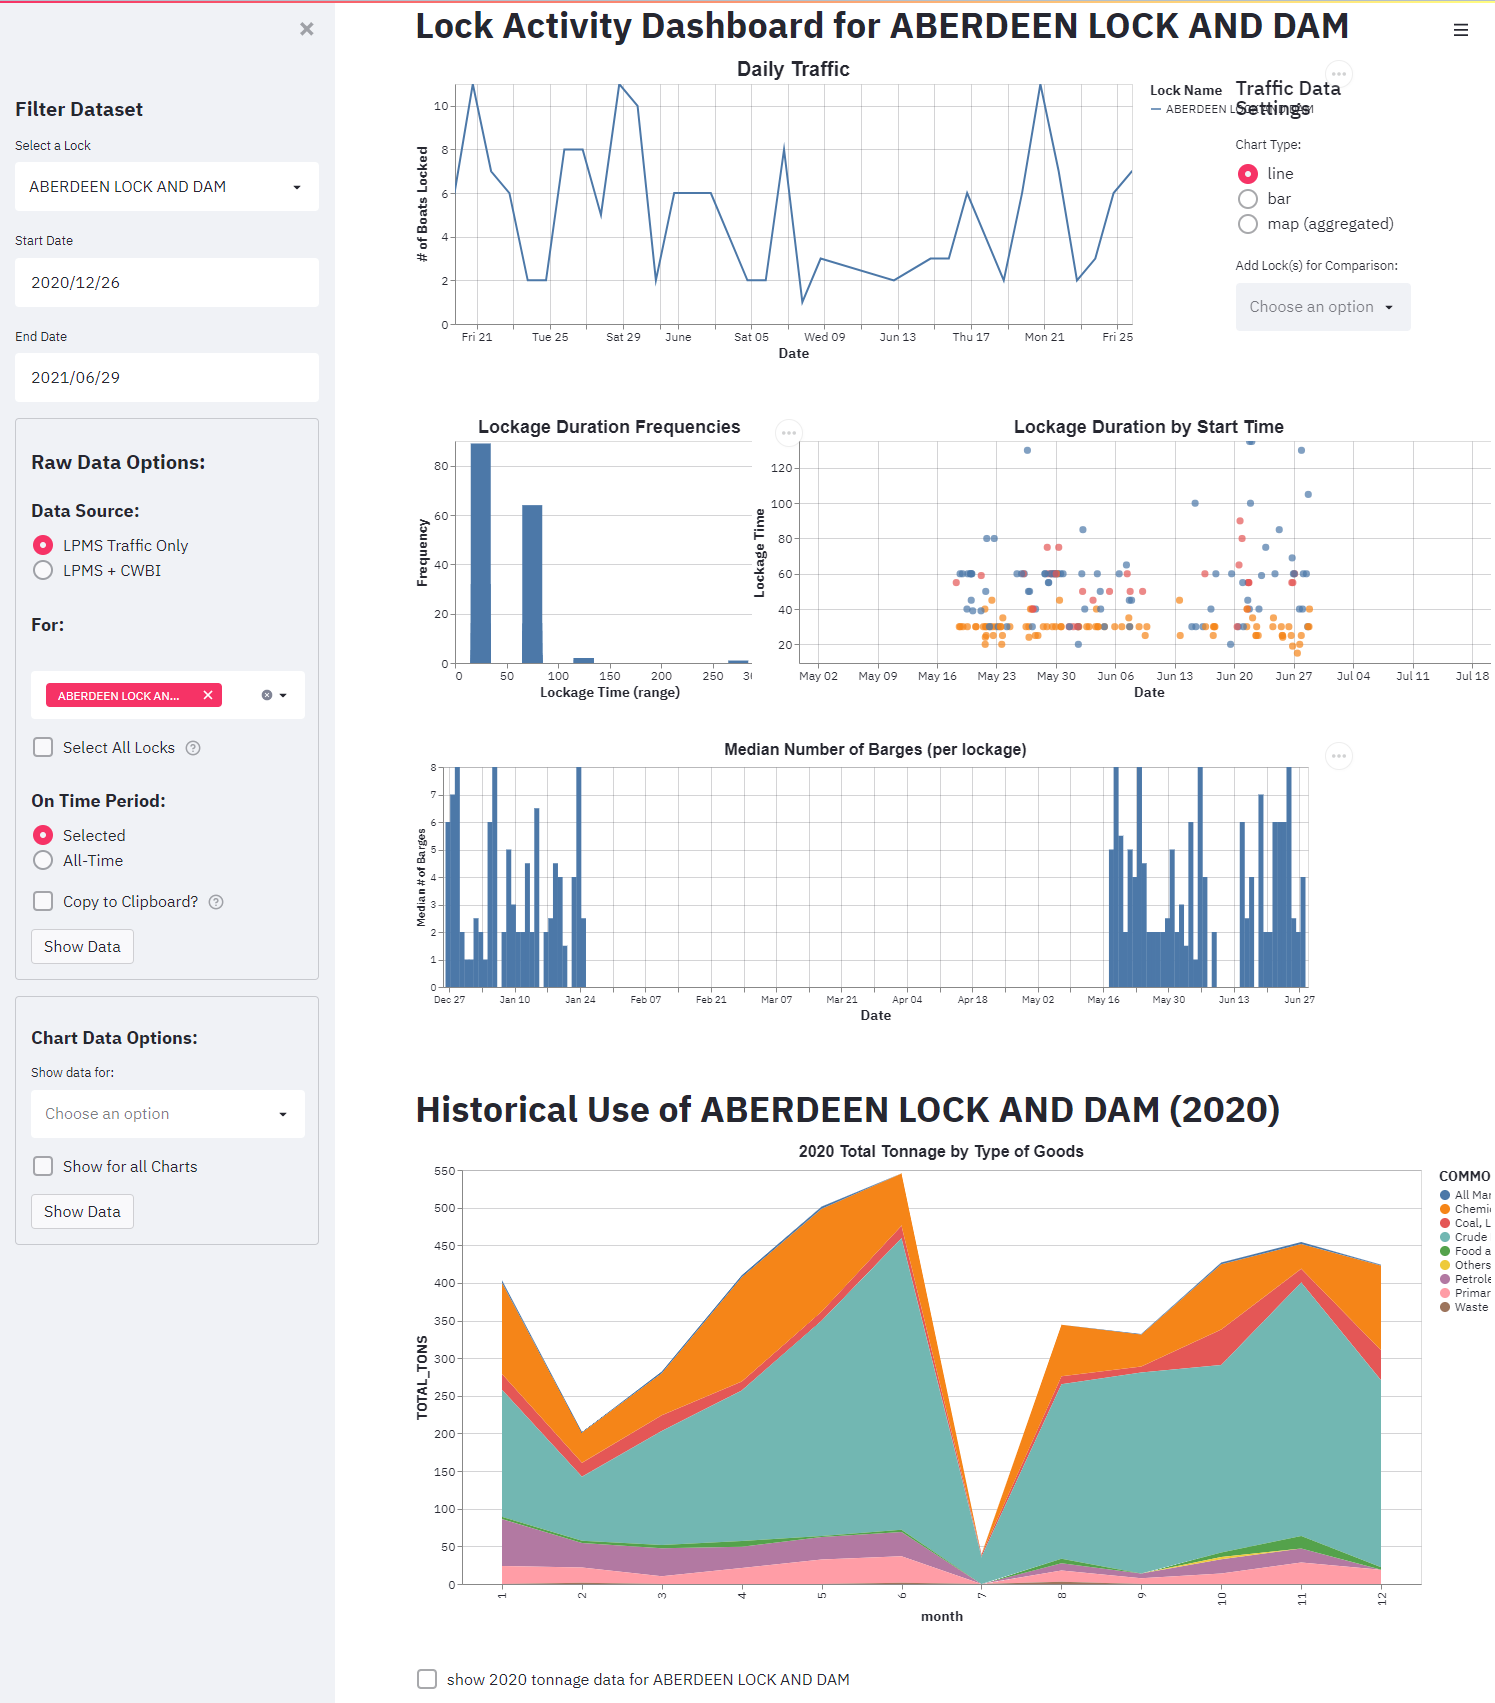
Interactive Applications (or Dashboards)
Driven by the research objectives outlined in the use cases, two interactive dashboards avaialable. These are built using Streamlit and facilitate guided, research focused explorations of specific datasets. The example below examines highlights activity captured in the USACE Lock Performance Monitoring System (LPMS).
Two other applications (dashboards) are available as Resources in the Hub.
Python API and Package
TransMAP Hub also comes with a companion Python package that supports seamless imports of datasets hosted within the repository. The pacakge has methods to extract data using spatial and temporal filters, exports the data into GeoPandas Data Frames, and has built-in mapping functions to produce both static and interactive maps. Static maps use the matplotlib package while the interacitve maps use the KeplerGL, a Python-based package that creates lightweight GIS environments in both Jupyter notebooks and generic html documents. The transmap package (currently at version 1.0.1) will eventually be published in both PyPI and conda forge. The package is also availabe from the the TransMAP Hub main page.
Details on installation and use examples can be found in the Using the TransMAP API How To notebook.